VMのメトリクスアラートの設定
VM Insights始め方
VM > Monitoring > Insights でEnable をクリック
Monitoring workspaceというのに紐づける必要があるようで、選択します。 defaultのものが私の場合は存在していました。

Monitor > Insights > Virtual Machinesで存在を確認。

VMの死活監視をする。
死活監視のためにInsightsを有効にする。
Tutorial - Alert when Azure virtual is down - Azure Monitor | Microsoft Docs
Monitor > Logsで以下のように入力するとHeartbeatが確認できる。
Heartbeat
| where Computer == 'vm name'
| where TimeGenerated > ago(10m)
みたいにして検索してみる。

その後、New alert ruleをクリック。
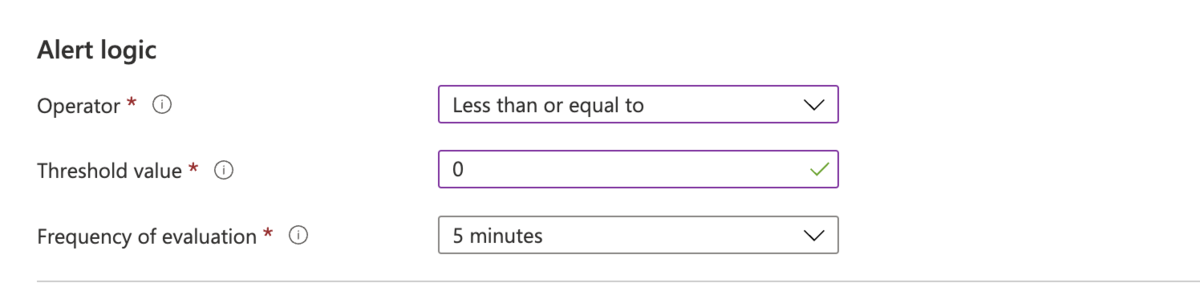
Log queryやMeasurementは勝手に入力されていて、必要に応じて変更できる。 Alert logicで0以下のときにアラートを設定
あとはaction groupや名前などを設定して作成する。
テストするには?
対象のVMをストップ
放っておくとalertが確認できました。

再起動しても鳴り続けるアラート
再度VMをスタートすれば、アラートが解除されると思ったのですが、アラートは鳴り続けてしまっています。
治し方がわからなかったので、別のVMを作り同様の手順を行ったところ、再起動後にもheartbeatを確認できました。
Heartbeatの頻度は?
60秒に一回っぽい
Agent Health solution in Azure Monitor - Azure Monitor | Microsoft Docs
参考
Tutorial - Alert when Azure virtual is down - Azure Monitor | Microsoft Docs
Monitor virtual machines with Azure Monitor: Alerts - Azure Monitor | Microsoft Docs